remote sensing

our work
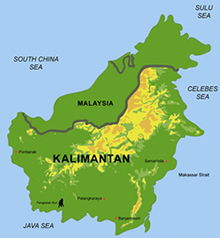
kalteng remote sensing shows trends in environments like Kalimantan.
- TanDEM-X elevation model data for canopy height ...
- Monitoring Forest Threats with C- and L-band SAR, ...
- Ground Penetrating Radar Mapping of Peat ...
- Spectral Variability and Discrimination ...
- Kalteng Consultants Company Profile, Oct
- Visiting of Wetlands International Camp on ...
- Ortho Photo Mosaik von Kelurahan Tumbang Tahai ...
- Ortho-Photo Mosaik from Lake Batu, north of ...
- International Symposium & Workshop on Tropical ...
- The Contribution of CHRIS/PROBA Data for Tropical ...
- Workshop on Spatial Planning and new Remote ...
- Ortho-Photo Generation and Mosaiking of City ...
- Ortho-Photo Mosaik from Kecamatan Bukit Batu, ...
- International Workshop, Wild Fire and Carbon ...
- Planning Group for Kecamatan Bukit Batu gathered ...
- Carbon Storage in the Northern Sabangau Area ...
- Peat Land Topography derived from 30m Resolution ...
- Peat depth, minerals below peat, carbon, fires ...
- Carbon Storage in the Northern Sebangau Area ...
- Peatland Topography DEM-measurements with ...
- Precise Measurements of Peatland Topography and ...
- Environmental Management Study of the Tangkiling ...
- Environmental Field Trials and GIS Image ...
- Land Cover Change on Peatland in Kalimantan ...
- The Impact of Logging and Land Use Change in ...
- Tracks along the Kalimantan Highway from Kasongan ...
- Fires in 2002 monitored on the Landsat-images 14 ...
- The Amount of Carbon released from Peat and ...
- Land use Change in Central Kalimantan over the ...
- Remote Sensing and Aerial Survey of Vegetation ...
- Monitoring land cover and impacts, Remote Sensing ...
- Fire Impacts and Carbon Release on Tropical ...
- Ecological Impact of the one Million Hectare Rice ...
- Land Use Change and (Il)-Legal Logging in Central ...
- Peat fires in Central Kalimantan, Indonesia: Fire ...
- Environmental Helicopter Flight Trails with ...
- Impact of the 1997 Fires on the Peatlands of ...
- Application of Remote Sensing and GIS to monitor ...
- Monitoring of 1997/1998 Fires and Burnt Scars in ...
- Flight survey over the Mega Rice Project and over ...
- Application of Remote Sensing and GIS to survey ...
- Mega Rice Project in Central Kalimantan, ...
- Satellite Images and Aerial Photos from the ...
- The need for better
- Remote Sensing Verification by Aerial Surveys and ...
- NATURAL RESOURCE FUNCTIONS, BIODIVERSITY AND ...
- Excursion to Central Kalimantan, ...
- Satellite Images and Aerial Photography’s from ...
- Symposium of International Peat Society, ...
- Indonesia Travel to Jakarta, Bali and Kalimantan ...
- The Mega Rice Project Central Kalimantan ...
- Land Use Planning and Environmental Monitoring in ...
- Bildverarbeitung von Sensorbildern zur Erstellung ...
- GIS-Workshop, Camp km48 Sangai.
- Monitoring Land Use Change on Tropical Peatland ...
- Seminar on Scientific Implications of the ...
- Report of Ground Truth Campaigns incl. Aerial ...
- Ground and Helicopter verification of Satellite ...
- Environmental Detection from Satellite and ...
- First visit to Central Kalimantan in June 1995, ...
- Environmental Helicopter with Modular Sensor ...
- Remote Sensing with a Thermal Imager on an ...
- The Use of an Environmental Helicopter for the ...
- EUROMAR-SEASTARS a Modular Multi-Sensor System ...
gallery

image gallery
Find a large collection of images from many years of exploration by kalteng-consultants.
History Borneo - Kalimantan · Excursions to peatland 1996 · Mega Rice Project 1999 · 2004 · 2005 · 2006 · 2007 · 2008 · 2009 · 2010 · 2011 · 2012 · 2013 · 2014 · 2015 · 2016-March · 2016-August ·
remote sensing
Mega Rice Project in Central Kalimantan, Indonesia - Change Detection of Block A at Dadahup Area (Rivers Barito, Kapuas Murung and Mengkatip), 6-1999
Poster for IGARSS Conference in Hamburg, Germany , 28.6. - 2.7.1999

Dr. H.-D.V. Boehm, Dr. F. Siegert and N. Zain Muhamad
Kalteng Consultants München, Germany
Tel: *49-8102-774848, Fax: *49-8102-774850
e-mail: viktorboehm@t-online.de
The development of wetland for sawah doe cultivation in Indonesia is not new. The big scale sawah rice field "Mega Rice Project" was inifiated in 1995 by Presidential Decree No. 82. (Development of One Million Hectares of Peatland for Food Crop Production in the Province of Central Kalimantan, Peat reclamation). The settlement of 350,000 families into this area was planned by the Ministry of Transmigration. Until today, approx. 13,000 families in the Dadahup - Lamunti region were settled, facing hard conditions on clear-felled areas. Over 4000km of channels were built with high time pressure from Spring 1996 to 1998 (compare satellite images from these period) using US$ 225 million from the Indonesian reforestation fund.
The winners were forest industry and canal construction companies. After the Indonesian economic crisis of 1997/1998 the financial situation became worse. During this time frame, between autumn 1997 and spring 1998, draught and heavy fires mewed as well. The fragile peat swamp eco-system was cleared or burned. Most of the Central Kalimantan fires 1997/98 were man-made. Huge amounts of stored carbon were released into the atmosphere. Peatland destruction is an irreversible proce. Countless floats transport timber over black-water lakes and along channels and rivers. Big areas of ecologically damaged peat-landscape are visible from the air.
The huge peatdomes between the main rivers Barito, Kapuas, Kahayan and Sebangau create massive problems for the hydrology. The region is drying out, the water table is low, questions of the water management remain unsolved. The soil of the the "Mega-Rice-Project" is largely unsuitable for rice plantation due to the big peatlayers found there. The normal peat pH value is between 3 and 4.
The tradegy of this peatland eco-system with its many plants and animals is very severe. The time sequence (May 1996 to March 1998) of the images below are taken from an area in the Block-A of the Mega Rice Project around Dadahup. Figure 1: LANDSAT-TM RGB = 543, 10 May 1996. The construction of the channels has just started, see red lines near the rivers. Peat swamp forest area are visible in green colour. Figure 2: LANDSAT-TM RGB = 543, 29 May 1997. The constraction of the channels are nearly completed in this area. The image shows the situation before the draught and fires in autumn 1997. Figure 3: LANDSAT-TM RGB = 747, 29 March 1998. This image is taken after the big fires and is partly covert with cloud and haze. Red areas are the burned scars caused by the big fires of autumn and spring 1997 and 1998. Hardly no peat swamp forest were detected in the image. Figure 4: ERS Change detection image taken on 7 Nov. 1996 and 18 Sep. 1997. Burnt scars appear in reddish colours and peat swamp forest in greenish colours. Construction of new channels are visible. Light blue colours in the middle of the images indicates water. Figure 5: ERS filter technique. 27 Nov. 1997.
The ERS image shows RGB colours after different filter techniques. The new channels can be monitored easily. Darker and lighter colours show different textures. Figure 6: RADARSAT filter technque. 28 Nov. 1997. The RADARSAT image shows RGB colours after different filter techniques. The new channels can be monitored as well. The texture differences to the ERS image (Fig. 5) is due to the different viewing angle of the sensor in the satellite. Figure 7: SPOT image from 29 July 1997. Burnt scars appear in greenish colour and peat swamp forest and vegetation is shown in reddish colour. Construction of the new channels are visible. Fires and the resulting smoke had just started (Image courtesy of CRISP, Singapore). Figure 8: SPOT image from 8 September 1997. Burnt scars appear in greenish colour and peat swamp forest and vegetation is shown in reddish colour. More clear cutes and heavy man made burning areas are visible, compare Fig. 7 above. Fires and the resulting smoke is seen in the image (Image courtesy of CRISP, Singapore). Figure 9: SPOT image from 25 January 1998. The image again shows part of the Mega Rice Project after the big fires 1997 with cultivated areas (Image courtesy of CRISP, Singapore).